172
172
Total
trades
139
Winning
trades
81%
Winning
history
90%
Average
return
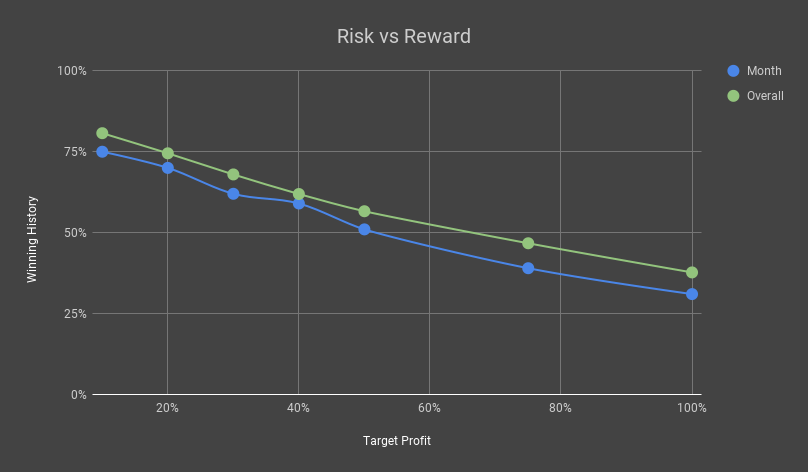
Our analysis of past Monthly Options trades for October indicates the month has underperformed the strategy as a whole. This mirrors overall market sentiment with October typically being a weak month for the market. In spite of this, the strategy has still maintained 8 out of 10 winners since 2002 and provides an average return of 90%. A review of past trades show mostly losing trades in 2014 and 2018, but otherwise primarily winning trades.

| Stock | Plays | Wins | Win HistWinning History | Avg %Average Return |
|---|---|---|---|---|
| AAPL | 13 | 12 | 92% | 97% |
| AMZN | 13 | 8 | 62% | 68% |
| AVGO | 9 | 9 | 100% | 89% |
| BIDU | 5 | 3 | 60% | 50% |
| DIA | 17 | 13 | 76% | 59% |
| GOOG | 12 | 10 | 83% | 210% |
| IBM | 12 | 9 | 75% | 66% |
| QQQ | 18 | 15 | 83% | 85% |
| SPY | 8 | 6 | 75% | 88% |
| WYNN | 10 | 8 | 80% | 117% |
| YHOO | 5 | 4 | 80% | 79% |
Based on the historical data, we would recommend trading very conservatively for this October. Both the DOW and NASDAQ are bouncing off testing recent lows and October is typically a week month for the market. On the plus side, we have seen winning months for our strategy, however, and we are not facing all time highs as we have for the most part of this year. That said, take whatever the market yields and move on to avoid unnecessary risk.
Adjust focus on lower returns for October, 15% - 30%.
78%
81%
20+

Check out our suite of trading websites designed to help generate profit for any type of trader or portfolio.