133
Total
trades
98
Winning
trades
74%
Winning
history
62%
Average
return
For January 2020 we have analyzed 133 options trades over the last 17 years. Our analysis show January as under performing for our monthly options strategy. Most notably, the winning history (wins / trades) is almost 10 percent lower than the average for the strategy as a whole. Additionally, the average return for our monthly options in January is well below the overall strategy at just 62%.
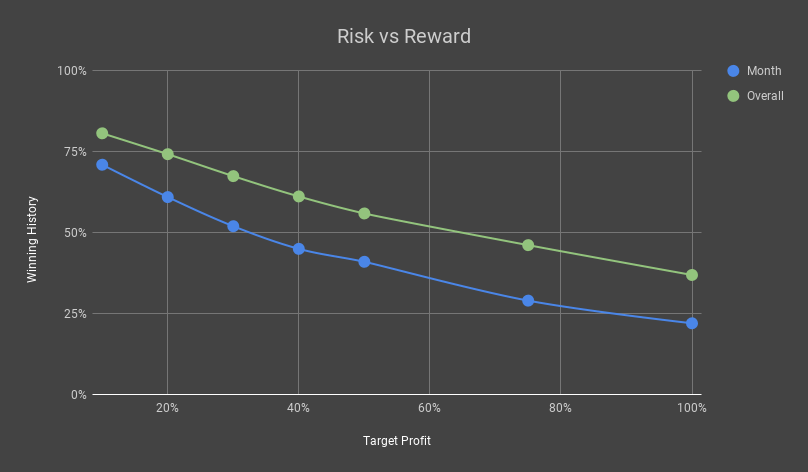
The risk vs. reward chart which tracks winning histories at desired rates of return mirrors the key statistics. January is well below each desired rate of return for the strategy as a whole.
The trade history for January reveals mostly modest winning trades with several losing trades occurring randomly throughout the recorded results. Only 2002 appears to have been mostly losing trades.
Pursue much lower returns for January. We recommend 20% - 30% ROI. AAPL would be the only exception for those who are less risk averse.

| Stock | Plays | Wins | Win HistWinning History | Avg %Average Return |
|---|---|---|---|---|
| AAPL | 7 | 7 | 100% | 116% |
| AMZN | 9 | 6 | 67% | 70% |
| AVGO | 6 | 4 | 67% | 89% |
| BIDU | 6 | 5 | 83% | 86% |
| DIA | 15 | 11 | 73% | 64% |
| IBM | 9 | 7 | 78% | 73% |
| QQQ | 12 | 9 | 75% | 47% |
| WYNN | 7 | 7 | 100% | 142% |
| YHOO | 5 | 3 | 60% | 17% |
78%
81%
20+

Check out our suite of trading websites designed to help generate profit for any type of trader or portfolio.