D :
H :
M :
S  Sale Ends
Consistent Profitable Options

March 2017 Pre-trade Analysis

Last month was absolutely stellar for members who traded the Core Strategy. All trades produced outstanding results, easily besting our 30% - 50% target profit range. As we turn our attention to March, thing look a bit grim.

There are no two ways about it, March is the worst performing month based on past trades. That said, we are still looking at a 70% winning history. Isn't it amazing how a 70% winning history seems bad when we are used to 80% or better? To add insult to injury, March boasts one of the lower average returns of just 80% (January is 51%).

If look at the trade history, an interesting story unfolds. March has been unusually polar. We either have all winners or all losers compared to most months which typically have all winners or mostly winners with one or two losing trades.

As always, focus on our target guidelines to lock in profits when presented and then drop the trade.
Key Stats

125

Total
trades

87

Winning
trades

70%

Winning
history

80%

Average
return

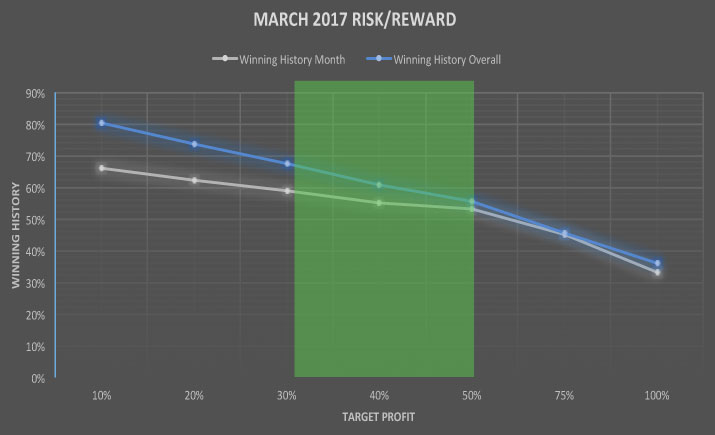
Risk vs Reward

This chart clearly illustrates how March under performs the strategy as a whole.

Successful Picks

No real surprises here, no clear winners, though AAPL looks promising.

Stock Plays Wins Winning History Average Return
AAPL 10 8 80.00% 95%
AMZN 7 5 71.43% 59%
DIA 15 10 66.67% 75%
EBAY 5 3 60.00% 108%
GOOG 5 3 60.00% 38%
IBM 10 8 80.00% 92%
QQQ 13 7 53.85% 36%
SPY 9 6 66.67% 49%
WYNN 5 3 60.00% 113%

Keep in mind we may no longer trade options for some of the stocks listed here.

Remember, no matter how great the statistics are or how good past trades were, you must set realistic limit orders to trade this strategy profitably. We highly recommend member's focus on our own target profit goals! As always, make money and happy trading!